Reproducible Runs
YAML configs, timestamped run folders, metrics, logs, plots, config snapshots, and run metadata.
Open-source analysis toolkit
Roboforming Geometric Coverage Analysis Toolkit
A reproducible Python toolkit for cluster-based geometry coverage analysis, gap identification, and analytical method comparison in Roboforming process data.
This website previews RGCAT’s methods and outputs. Source code, documentation, and installation instructions will be published with a later public release.
Developed by Per Starke as part of a master’s thesis, supervised by Jan Schäfer.
Overview
RGCAT turns tabular Roboforming geometry data into reduced representations, clusters, coverage metrics, gap candidates, reconstructed candidate features, and timestamped run outputs.
YAML configs, timestamped run folders, metrics, logs, plots, config snapshots, and run metadata.
PCA, VAE, and VaDE for representation; KMeans, HDBSCAN, and combo modes for clustering; configurable gap analysis.
Compare the original embedding with the same embedding plus selected analytical gap candidates.
Pipeline
Each run follows the same stage order; YAML controls representation, clustering, coverage metrics, and gap analysis.
CSV, Parquet, Feather
flat vectors, z-map features, context columns
PCA, VAE, VaDE
KMeans, HDBSCAN, combo
kNN coverage, sparse-region metrics
candidate sampling, ranking
candidate features, original space
analytical before/after metrics
metrics, plots, report, config snapshot
Outputs
Each run writes a timestamped folder with logs, metrics, plots, config snapshots, run metadata, and an optional static report dashboard.
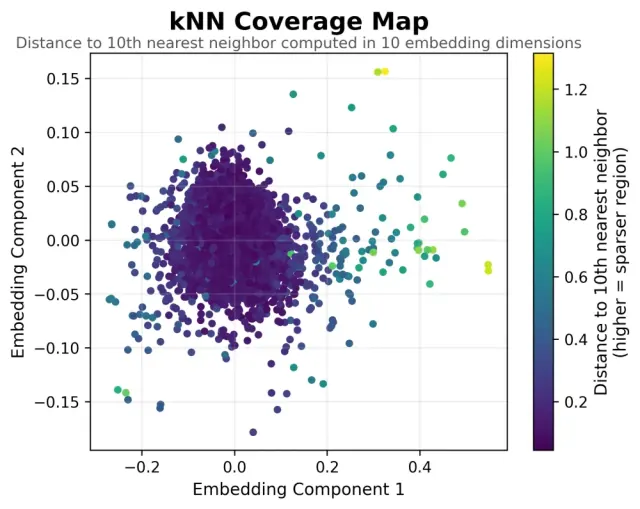
k-nearest-neighbor distances highlight sparse regions in the embedding.
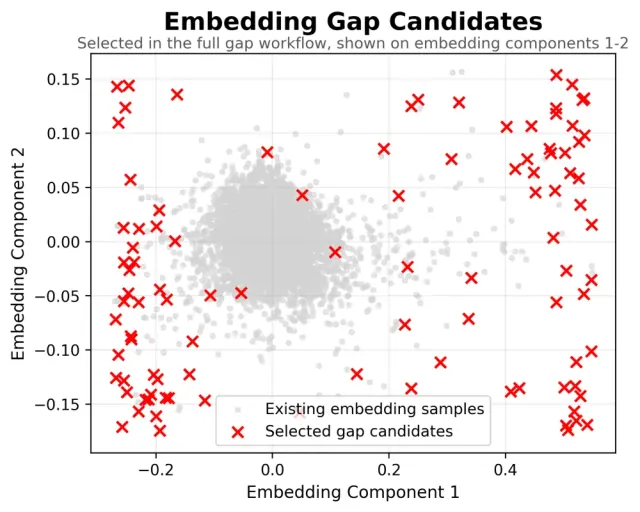
Analytical gap candidates shown against existing embedding samples.
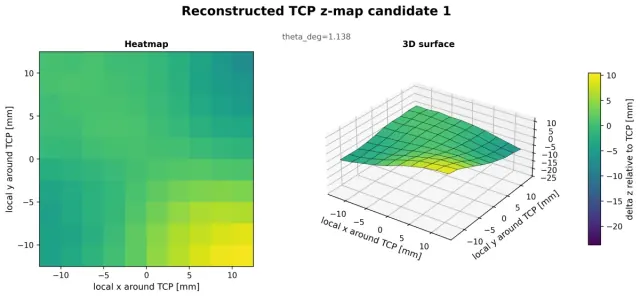
One analytical candidate reconstructed as heatmap and 3D surface.
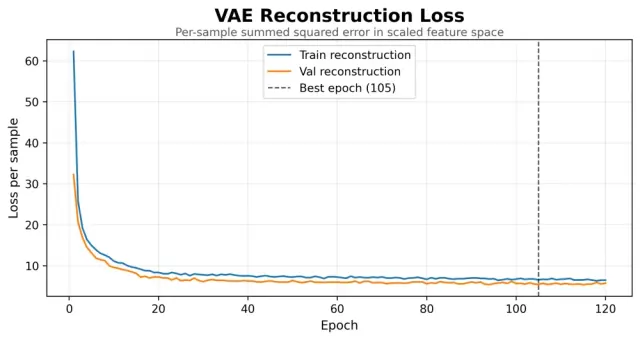
Training and validation loss for a VAE representation run.
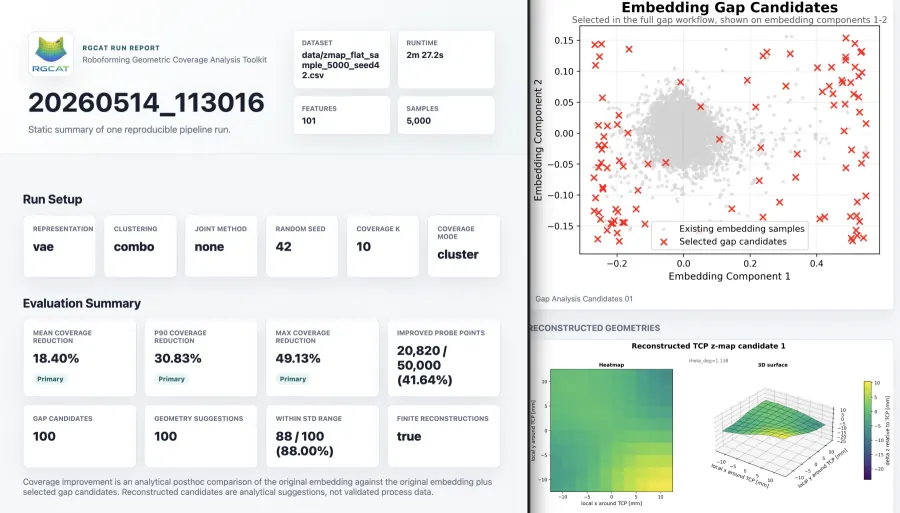
Run Dashboard
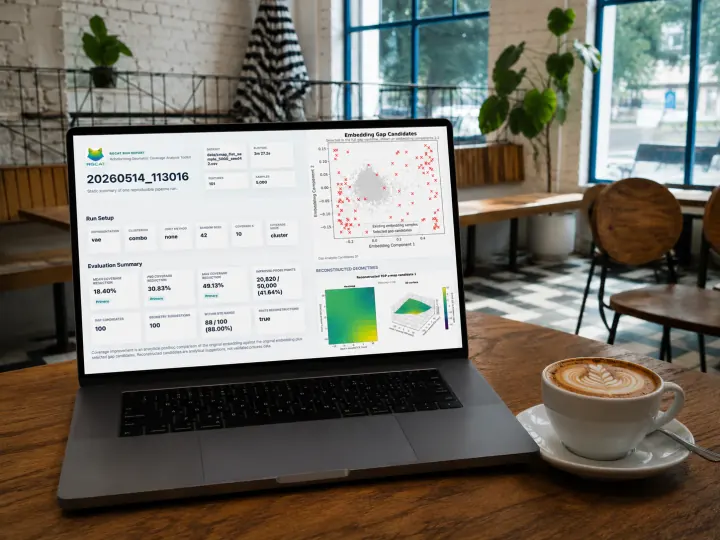
When reporting is enabled in the config, every successful run creates runs/<run_id>/report.html. It opens in a browser without a server and summarizes the saved run artifacts.
metrics.json, config.yaml, run_info.yaml, and logs.txt.Configuration reference available with the public release.
Files created by a run
runs/<run_id>/logs.txt
runs/<run_id>/metrics.json
runs/<run_id>/config.yaml
runs/<run_id>/plots/
runs/<run_id>/run_info.yaml
runs/<run_id>/report.html
Release status
The source repository is not yet publicly accessible. The software, reproducible environments, documentation, and license files will be published together in a later release.
Included with the public release
Method comparison
Use the same data, folder structure, metrics, and analytical before/after evaluation to compare pipeline variants reproducibly.
Coverage before/after
Cluster changes
Reconstruction summary
Candidate diagnostics
Reconstructed candidates are analytical suggestions, not validated process data.Documentation
The release will include the complete usage, configuration, pipeline, and architecture reference set.
License
The license file will be published together with the source repository.